TYBCOM SEM 5
International trade MCQS
1.According to this theory, the holdings of a country’s treasure primarily in the form of gold constituted its wealth.
a. Gold Theory
b. Ricardo Theory
c. Mercantilism
d. Hecksher Theory
Ans:C
2. The Theory of Absolute Cost Advantage is given by
a. David Ricardo
b. Adam Smith
c. F W Taylor
d. Ohlin and Heckscher
Ans: A
3. The Theory of Relative Factor Endowments is given by
a. David Ricardo
b. Adam Smith
c. F W Taussig
d. Ohlin and Hecksher
Ans:D
4. The theory of comparative cost advantage is given by
a. David Ricardo
b. Adam Smith
c. F W Taussig
d. Ohlin and Hecksher
Answer: a
5. ……………is the application of knowledge which redefines the boundaries of global
business
a. Cultural Values
b. Society
c. Technology
d. Economy
Answer:c
6. Capitalistic, communistic and Mixed are the types of
a. Economic System
b. Social System
c. Cultural Attitudes
d. Political System
Answer:a
7. Which is not an Indian Multinational Company?
a. Unilever
b. Asian Paints
c. Piramal
d. Wipro
Answer: a
8. Globalization refers to:
a) Lower incomes worldwide
b) Less foreign trade and investment
c) Global warming and their effects
d) A more integrated and interdependent world
Answer: d
9. Which of the following is not a force in the Porter Five Forces model?
a. Buyers
b. Suppliers
c. Complementary products
d. Industry rivalry
Answer:c
10. …….is the payment method most often used in International Trade which offers the
exporter best assurance of being paid for the products sold internationally.
a. Bill of Lading
b. Letter of Credit
c. Open Account
d. Drafts
Answer: b
Mcq of International Trade
1. The classical theory of international trade assumes __________.
a. One Factor of Production
b. One Country
c. Closed Economy
d. One Commodity
2. Income terms of trade is given by __________.
a. Viner
b. Dorrance
c. Adam Smith
d. Ricardo
3. According to the gains from trade theory, smaller countries gain __________ from
trade than big countries.
a. More
b. Same
c. Proportionately
d. Less
4. The theory of absolute difference in cost is given by __________.
a. Adam Smith
b. Ricardo
c. Haberler
d. Heckscher-Ohlin
5. Ricardian theory assumes perfect mobility of labor ___________.
a. Within the country
b. Between countries
c. Within a state
d. Between two states
6. Ricardian theory is criticized on the grounds of __________.
a. Ignorance of demand
b. Unrealistic assumptions
c. Complete specialization
d. All of the above
7. The factor endowment theory of international trade was given by
______________.
a. Adam Smith
b. Haberler
c. Heckscher-Ohlin
d. Sameulson
8. The assumption of two-country, two-commodity and two-factor of production is a
part of __________ theory of international trade.
a. Ricardian
b. Modern
c. Absolute Advantage
d. None of the above
9. If physical capital-labor ratio of country A is greater than physical capital-labor
ratio of country B, then __________.
a. Country A is abundant in capital
b. Country B is abundant in capital
c. Country A is abundant in labor
d. Country B is scarce in labor
10. If the ratio of price of labor to price of capital of country A is lesser than the ratio
of price of labor to price of capital of country B, then __________.
a. Labor is cheap in country A
b. Labor is cheap in country B
c. Labor is expensive in country A
d. Capital is expensive in country B
11. Factor abundance in physical terms can be explained with the help of
__________.
a. Production possibility curves
b. Price Line
c. Iso-cost lines
d. Equilibrium price determination
12. Which of the following statements is/are true?
a. The HO theory can be extended to many commodities and countries.
b. The HO theory is limited to two commodities.
c. The HO theory is limited to two countries.
d. The HOT theory is limited to two factor of production.
13. According to HO theory, international trade is but a special case of
____________ trade.
a. Inter-regional
b. Inter-district
c. Sub-local
d. Sub-regional
14. The ratio of price of export commodity to the price of import commodity is called
_______________.
a. Terms of trade
b. Absolute advantage
c. Comparative advantage
d. Factor Endowment
15. On the basis of productivity of factors of production, terms of trade are classified
as ____________.
a. Single factorial TOT
b. Double factorial TOT
c. Both a and b
d. Neither a nor b
16. Qm/Qx is the formula for ___________.
a. Gross Barter TOT
b. Net Barter TOT
c. Income TOT
d. Factorial TOT
17. The concept of single and factorial terms of trade was given by ____________.
a. Jacob Viner
b. Adam Smith
c. Ricardo
d. Sameulson
18. Which of the following factors affect terms of trade?
a. Changes in factor endowment
b. Reciprocal Demand
c. Economic development
d. All of the above
19. The strength of India’s demand for US exports in exchange of US demand for
India’s exports is called ______________.
a. Reciprocal Demand
b. Reverse Demand
c. Restricted Demand
d. Unilateral Demand
20. Gross barter terms of trade takes into account ___________.
a. All goods
b. All services
c. Both a and b
d. Trade items and unilateral payments
21. Terms of trade are favorable if current year index in comparison of base year
index is ____________.
a. Less
b. More
c. Same
d. Zero
22. The concept of reciprocal demand was given by ___________.
a. Jacob Viner
b. J. S. Mill
c. Adam Smith
d. Ricardo
23. Autarkic economy means _____________.
a. Absence of international economic relations
b. Limited international economic relations
c. Free international economic relations
d. Restricted international economic relations
24. The rate at which goods are produced and exchanged within the country is
expressed as ____________.
a. Domestic Exchange Ratio
b. International Price Ratio
c. Local Exchange Ratio
d. Domestic Price Ratio
25. Graphical representation of reciprocal demand indicating various quantities of
exports that a country is willing to give in exchange of imports is represented
through ________________.
a. Offer Curves
b. Price Lines
c. Exchange Ratios
d. Price Ratios
26. An offer curve _______________.
a. Differs from a usual supply curve
b. Differs from a usual demand curve
c. Both a and b
d. Neither a nor b
27. Cultural changes due to international trade _______________.
a. Are always Positive
b. Are Always Negative
c. Are Always Stagnant
d. Both a and b
28. International trade ____________.
a. Stimulates innovations
b. Brings down cost of production
c. Diversifies consumption
d. All of the above
29. International trade increases economic welfare of _____________.
a. Exporting country
b. Importing country
c. Both a and b
d. Only a
30. The gain from trade is maximum if the international terms of trade are
_____________.
a. Nearer to internal terms of trade of trading partner
b. Equal to exporting country
c. Nearer to domestic terms of trade of importing country
d. None of the above
31. International trade increases the welfare of ____________________.
a. all participating countries
b. only exporting countries
c. only importing countries
d. none of the above
32. International trade increases the ___________ of participating countries.
a. Output
b. Profit
c. Risks
d. none of the above
33. Generally, the developing countries _____________ terms of trade.
a. Suffer from adverse
b. Enjoy favourable
c. Ignore
d. None of the above
34. The offer curve of a country is based on ____________.
a. Relative prices of two commodities
b. Price of exports
c. Price of imports
d. Supply of exports
35. The classical theory of international trade was presented by ________________.
a. David Ricardo
b. Hecksher-Ohlin
c. J. M. Keynes
d. Alfred Marshall
36. Hecksher-Ohlin theory states that the relative factor prices in two countries are
determined by ______________.
a. Differences in factor endowments
b. Labour efficiency
c. Technological developments
d. None of the above
37. Under ____________ type of cost difference, international trade will not take
place.
a. Equal
b. Absolute
c. Comparative
d. None of the above
38. Ricardian theory assumes that labour is ____________ within the country.
a. Homogeneous
b. Heterogeneous
c. Inefficient
d. Unequal
1. Consider the PPF diagram below.
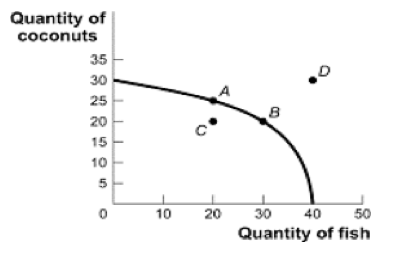
Given the PPF illustrated, what is the opportunity cost of moving from B to A?
a) 5 coconuts.
b) 10 fish.
c) 5/10 fish
d) 10/5 coconuts.
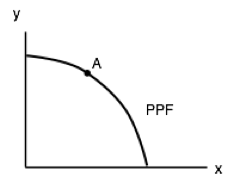
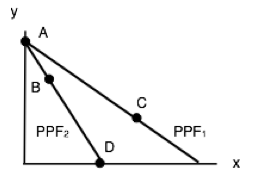
The following TWO questions refer the diagram below, which illustrates the PPF for a producer of two goods, x and y.
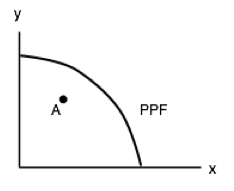
2. Which of the following statements is TRUE?
I. The marginal cost of producing x is higher at high levels of x than it is at low levels of x.
II. The marginal cost of producing y is higher at high levels of y than it is at low levels of y.
III. The marginal cost of producing both x and y is constant in the level of production.
a) I only.
b) II only.
c) III only.
d) I and II only.
3. If this economy is operating at point A, which of the following statements is TRUE?
I. The opportunity cost of producing more x is zero.
II. The opportunity cost of producing more y is zero.
III. Point A is inefficient.
a) III only.
b) I and II only.
c) I and III only.
d) I, II, and III.
The following TWO questions refer to the PPF diagram below.
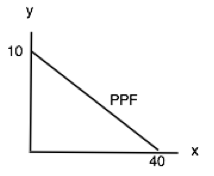
4. What is the MARGINAL cost of producing good y?
a) 1/4 of a unit of x.
b) 1/4 of a unit of y.
c) 4 units of x.
d) 4 units of y.
5. What is the cost of producing FOUR units of good y?
a) 16 units of x.
b) 4 units of x.
c) 1/4 of a unit of x.
d) 40 units of x.
6. Consider a PPF drawn with x on the horizontal axis and y on the vertical axis. Which of the following concepts can be used to explain why this production possibility frontier could be flat at relatively lows levels of x and steep at relatively high levels of x?
a) Increasing marginal costs.
b) Scarcity
c) Sunk costs.
d) Trade
7. Which of the following concepts can be used to explain why production possibility frontiers slope downwards.
a) Scarcity
b) Sunk costs.
c) Trade
d) Increasing marginal costs.
Exercises 2.3
1. The following question refers to the table below, which shows the maximum number of goods X and Y that producers A and B can produce in one day.
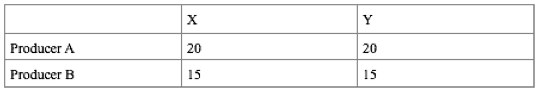
Which of the following statements in TRUE?
a) Producer A has the comparative advantage in producing X.
b) Producer A has the comparative advantage in producing Y.
c) Producer B has the absolute advantage in producing X and Y.
d) No producer has the comparative advantage in producing either X or Y.
2. Consider the PPF diagram drawn below, for two countries that are free to trade with one another.
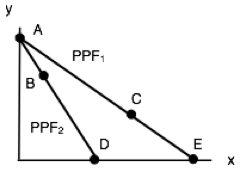
Which of the following production combinations is/are INEFFICIENT?
I. Country 1 produces at point C and country 2 produces at point D.
II. Country 1 produces at point E and country 2 produces point at B.
III. Country 1 produces at point E and country 2 produces at point A.
a) II only.
b) I only.
c) I and II only.
d) I, II and III.
3. The diagram below illustrates the PPFs for two countries that produce wine and cheese. With no trade, country 1 produces at point A on its PPF and country 2 produces at point B.
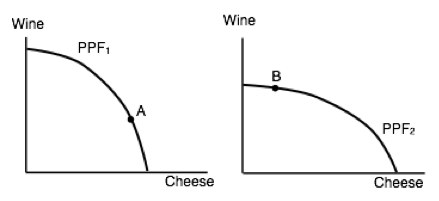
Assume that the two countries now begin to trade with one another. Which of the following will NOT occur (relative to the case with no trade).
a) Country 1 will produce less cheese.
b) Country 2 will export wine.
c) Country 1 will import cheese.
d) Country 2 will produce more cheese.
4. Which of the following statements about production and trade is FALSE?
I. If a country has an absolute advantage in producing a good, then it also has the comparative advantage in the production of that good.
II. Rich countries will generally have the comparative advantage in the production of all goods.
III. If a country has the absolute advantage in the production of a good, then this country will be made better off by specializing in the production of that good.a) I only.
b) I and II only.
c) I, II and III.
d) III only.
The following THREE questions refer to the diagram below, which illustrates the PPFs for two countries who are free to trade.
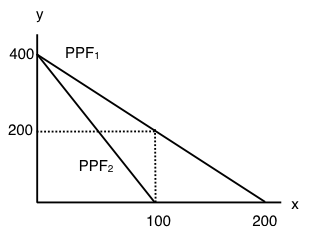
5. What is the marginal opportunity cost (MC) of producing good x in each country?
a) 2 units of good y in country 1 and 4 units of good y in country 2.
b) 1/2 a unit of good y in country 1 and 1/4 of a unit of good y in country 2.
c) 2 units of good y in country 1 and 1/4 of a unit of good y in country 2.
d) 1/2 a unit of good y in country 1 and 4 units of good y in country 2.
6. What is the marginal opportunity cost (MC) of producing good y in each country?
a) 2 units of good x in country 1 and 4 units of good x in country 2.
b) 1/2 a unit of good x in country 1 and 1/4 of a unit of good x in country 2.
c) 2 units of good x in country 1 and 1/4 of a unit of good x in country 2.
d) 1/2 a unit of good x in country 1 and 4 units of good x in country 2.
7. Suppose that aggregate production of x across the two countries is equal to 100 (that is, country one’s production of x plus country two’s production of x equals 100 units). If these 100 units of x are being produced efficiently, then aggregate production of y will equal:
a) 200 units of y.
b) 400 units of y.
c) 600 units of y.
d) 800 units of y.
8. The diagram below illustrates the identical PPFs of two countries.
Initially, there is no trade allowed between the two countries, and each country produces at point A. If trade is opened up, which of the following will occur?
I. Country 1 will export coal to country 2.
II. Country 2 will produce more clothing.
III. Country 1 will produce less coal.
a) I and II only.
b) III only.
c) II and III only.
d) None of the above.
9. The table below shows the maximum amounts of coffee and salmon that Brazil and British Colombia can produce if they just produce one good.
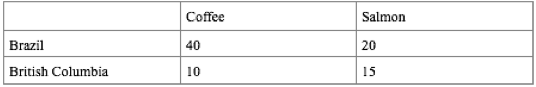
Assuming constant marginal costs:
a) Brazil has a comparative advantage in coffee production
b) In Brazil, the marginal cost of salmon production is 2 units of coffee.
c) In BC, the marginal cost of coffee production is 1½ units of salmon.
d) All of the above are correct.
10. The diagram below illustrates the PPFs for two countries that produce two goods. The two countries are free to trade with one another.
Which of the following production combinations are efficient?
a) Country 1 is at point C; country 2 is at point D.
b) Country 1 is at point A; country 2 is at point B.
c) Country 1 is at point C; country 2 is at point A.
d) All of the above are efficient.
Solution:-
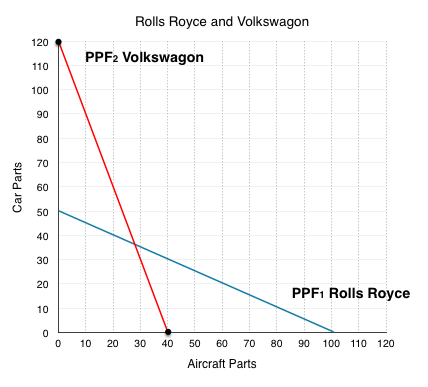
1. Rolls Royce can produce either 50 car parts, 100 aircraft parts, or a combination or both. Represent cars parts on the y-axis and aircraft parts on the x-axis. Draw Rolls Royce PPF on the diagram below. Assume the PPF is linear.
The best way to draw a PPF is to find how many of each good the firm can produce if they produce that good only. In this case we are told Rolls Royce can either produce 50 car parts, 100 aircraft parts, or a mix. This means we know the point (0, 50) and (100, 0) are on our PPF. Simply label these points and connect them to find Rolls Royce’s PPF.
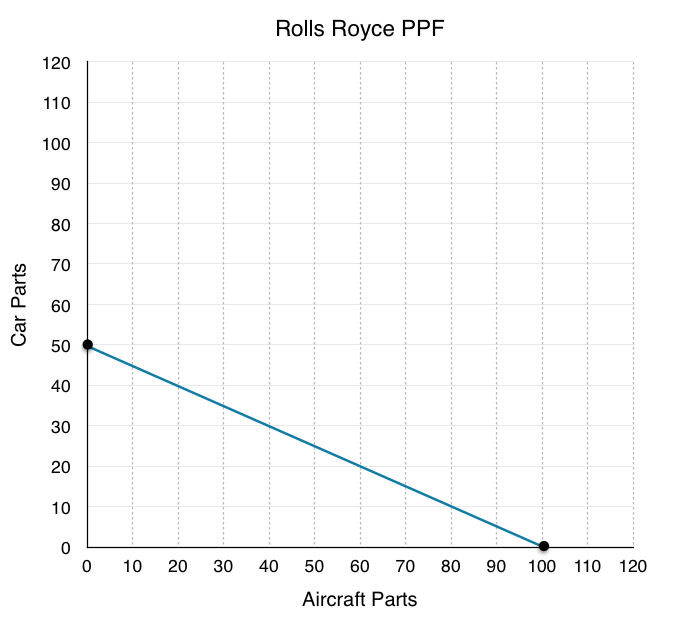
2. For Rolls Royce, what is the marginal opportunity cost of 1 aircraft part? 1 car part?
Remember that the marginal opportunity cost of the good on the x-axis, in this case aircraft parts, is simply the slope of the PPF. Taking the slope we find that we must trade 50 car parts for every 100 aircraft parts, this means that the marginal opportunity cost of one aircraft part is 0.5 car parts.
The marginal opportunity cost of the good on the y-axis, in this case car parts, is equal to the inverse of the slope. This means we must trade 100 aircraft parts for every 50 car parts. The marginal opportunity cost of one car part is 2 aircraft parts.
3. If Rolls Royce needs to produce 40 aircraft parts, how many car parts can they make?
Since there is no opportunities for trade, this is a relatively simple problem. All you have to do is draw a line up from 40 aircraft parts, and see how many car parts Rolls Royce can make with the remaining resources.
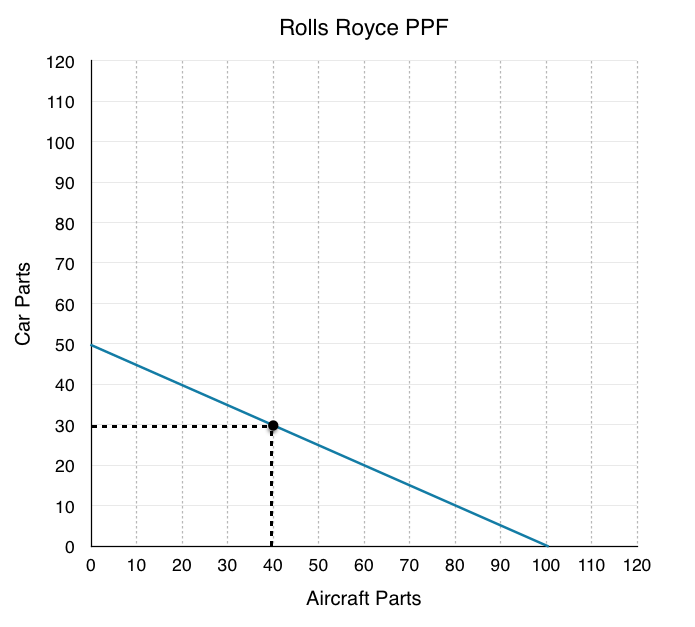
Looking at the diagram you can see that when Rolls Royce produces 40 aircraft parts, they can produce 30 car parts.
Rolls Royce can produce a maximum of 100 aircraft parts, and for every 10 they give up they can make 5 car parts. If they are only producing 40 aircraft parts they have given up 60. The trade off in the production of 60 aircraft parts allows them to produce 30 car parts.
4. Volkswagon can produce either 120 car parts, 40 aircraft parts, or a combination or both. Represent cars parts on the y-axis and aircraft parts on the x-axis. Draw Volkswagon’s PPF on the diagram below, and redraw Rolls Royce’s PPF from question 1. Assume both PPFs are linear.
Again, the best way to draw a PPF is to find how many of each good the firm can produce if they produce that good only. Based on the information we are given, we know the points (0, 120) and (40, 0) are on Volkswagon’s PPF. Simply label these points and connect them to find Volkswagon’s PPF.
5. For Volkswagon, what is the marginal opportunity cost of 1 aircraft part? 1 car part?
Taking the slope of Volkswagon’s PPF, we find that we must trade 120 car parts for every 40 aircraft parts, this means that the marginal opportunity cost of one aircraft part is 3 car parts for 1 aircraft part.
The marginal opportunity cost of the good on the y-axis, in this case car parts, is equal to the inverse of the slope. This means we must trade 40 aircraft parts for every 120 car parts. The marginal opportunity cost of one aircraft part is 0.33 aircraft parts for 1 car part.
6. Who has the absolute advantage in the production of aircraft parts? Car parts?
The firm that can produce the greater number of each good has the absolute advantage in that goods production. Since Rolls Royce can produce 100 aircraft and Volkswagon only 40, Rolls Royce has the absolute advantage in aircraft parts. Since Volkswagon can produce 120 car parts and Rolls Royce only 50, Volkswagon has the absolute advantage in car parts.
7. Who has the comparative advantage in the production of aircraft parts? Car parts? Why?
Representing the marginal opportunity costs of each company on a table we can produce the following:
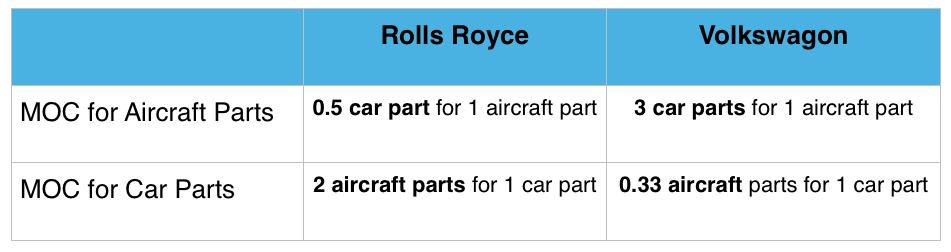
Recall that the firm with the lower opportunity cost has the comparative in the production of the good. In this case Rolls Royce only has to give up 0.5 car parts for 1 aircraft part, whereas Volkswagon has to give up 3! This means Rolls Royce has the comparative advantage in aircraft parts. Volkswagon only has to give up 0.33 aircraft parts for 1 car part, whereas Roll Royce has to give up 2. This means Volkswagon has the comparative advantage in car parts.
This means that when possible, Rolls Royce should specialize in the production of aircraft parts, since they have lower opportunity cost of producing them.
*Note that in this example each firm has both the competitive and absolute advantage in their good, but this need not be the case. One firm could have the absolute advantage at both goods, but there would still be mutually beneficial trades available.
8. Assume each firm needs 20 aircraft parts and cannot trade. How many car parts is each able to produce? What is the total amount of car parts?
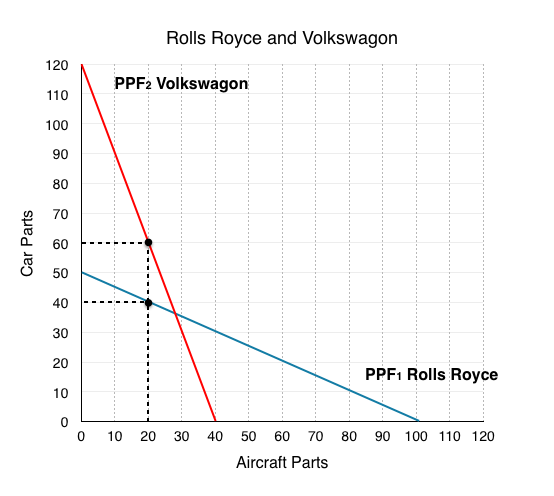
If the firms cannot trade with eachother then this exercise is identical to Question 3, just with two firms. All we have to do is draw a line up from 20 aircraft parts, and see how many car parts each can produce.
As shown in the diagram above, Rolls Royce can produce 40 car parts, and Volkswagon can produce 60 car parts for a total of 100.
9. If the market is opened up to trade, represent the efficient production of 40 aircraft parts on the PPF. What is the total number of car parts produced?
If the market is open to trade and we need 40 aircraft parts, they won’t be produced as they were in Question 8. When we are told how much of a specific good we want, the firm with the comparative advantage in that good will produce as much of that good as they can (up to the total). In this case Rolls Royce has the comparative advantage in aircraft parts so they will produce all 40. Notice that when Rolls Royce produces 40 aircraft parts, they are still producing 30 car parts – that is fine. We can not say that Rolls Royce should produce more than 40 because if we only want 40 aircraft parts, there is no reason to produce more (no one will buy them, there is no use for them, etc.). The remaining resources should be used to produce car parts.
If Rolls Royce is producing 40 aircraft parts, they are also producing 30 car parts. Since we do not need anymore aircraft parts, Volkswagon can focus on what they are comparatively better at and produce 120 car parts. This is the most efficient way for the firms to produce 40 aircraft parts and results in a total of 150 car parts (120 car parts from Volkswagon + 30 car parts from Roll Royce).
Note that this follows the rule in Topic 2.3 where we stated that if at least one player is maximizing their comparative advantage, then the situation is efficient (in this case Volkswagon is maximizing).
10. Explain why Brexit makes both companies worse off with reference to question 8 and 9.
Comparing the total number of parts with and without trade we see that the total number of goods are:
Without Trade: 40 Aircraft Parts, 100 Car Parts
With Trade: 40 Aircraft Parts, 150 Car Parts
Trade results in a Pareto improvement as the total number of car parts increases. This means that Brexit results in both companies having less car parts, which means less revenue.
Policy restricting trade has made it so neither company can focus on what they are comparatively good at. If Rolls Royce wants to produce cars, they have to produce the car parts themselves at higher costs. This is why we say there are ‘gains from trade’ as whether you were the British company or the German company, both parties stand to benefit.
Part 2:
No comments:
Post a Comment